Add a monitor to components
Overview
SUSE® Observability provides monitors out of the box, which provide monitoring on common issues that can occur in a Kubernetes cluster. It’s also possible to configure custom monitors for the metrics collected by SUSE® Observability or application metrics ingested from Prometheus.
Creating a monitor
Steps to create a monitor:
As an example the steps will add a monitor for the Replica counts of Kubernetes deployments.
Write the outline of the monitor
Open the monitors.yaml YAML file of your StackPack in your favorite code editor to change it throughout this guide. You can use the CLI to Test Your StackPack.
For example, this could be the start for a monitor which monitors the available replicas of a deployment:
- _type: Monitor
  arguments:
    metric:
      query: "kubernetes_state_deployment_replicas_available"
      unit: "short"
      aliasTemplate: "Deployment replicas"
    comparator: "LTE"
    threshold: 0.0
    failureState: "DEVIATING"
    urnTemplate:
  description: "Monitor whether a deployment has replicas.
  function: {{ get "urn:stackpack:kubernetes-v2:shared:monitor-function:threshold"  }}
  identifier: urn:stackpack:my-stackpack:monitor:deployment-has-replicas
  intervalSeconds: 30
  name: Deployment has replicas
  remediationHint:
  status: "ENABLED"
  tags:
  - "deployments"
The urnTemplate and remediationHint will be filled in the next steps.
Bind the results of the monitor to the correct components
The results of a monitor need to be bound to components in SUSE® Observability, to be visible and usable. The result of a monitor is bound to a component using the component identifiers. Each component in SUSE® Observability has one or more identifiers that uniquely identify the component. To bind a result of a monitor to a component, it’s required to provide the urnTemplate. The urnTemplate substitutes the labels in the time series of the monitor result into the template, producing an identifier matching a component. This is best illustrated with the example:
The metric that’s used in this example is the kubernetes_state_deployment_replicas_available metric. Run the metric in the metric explorer to observe what labels are available on the time series:
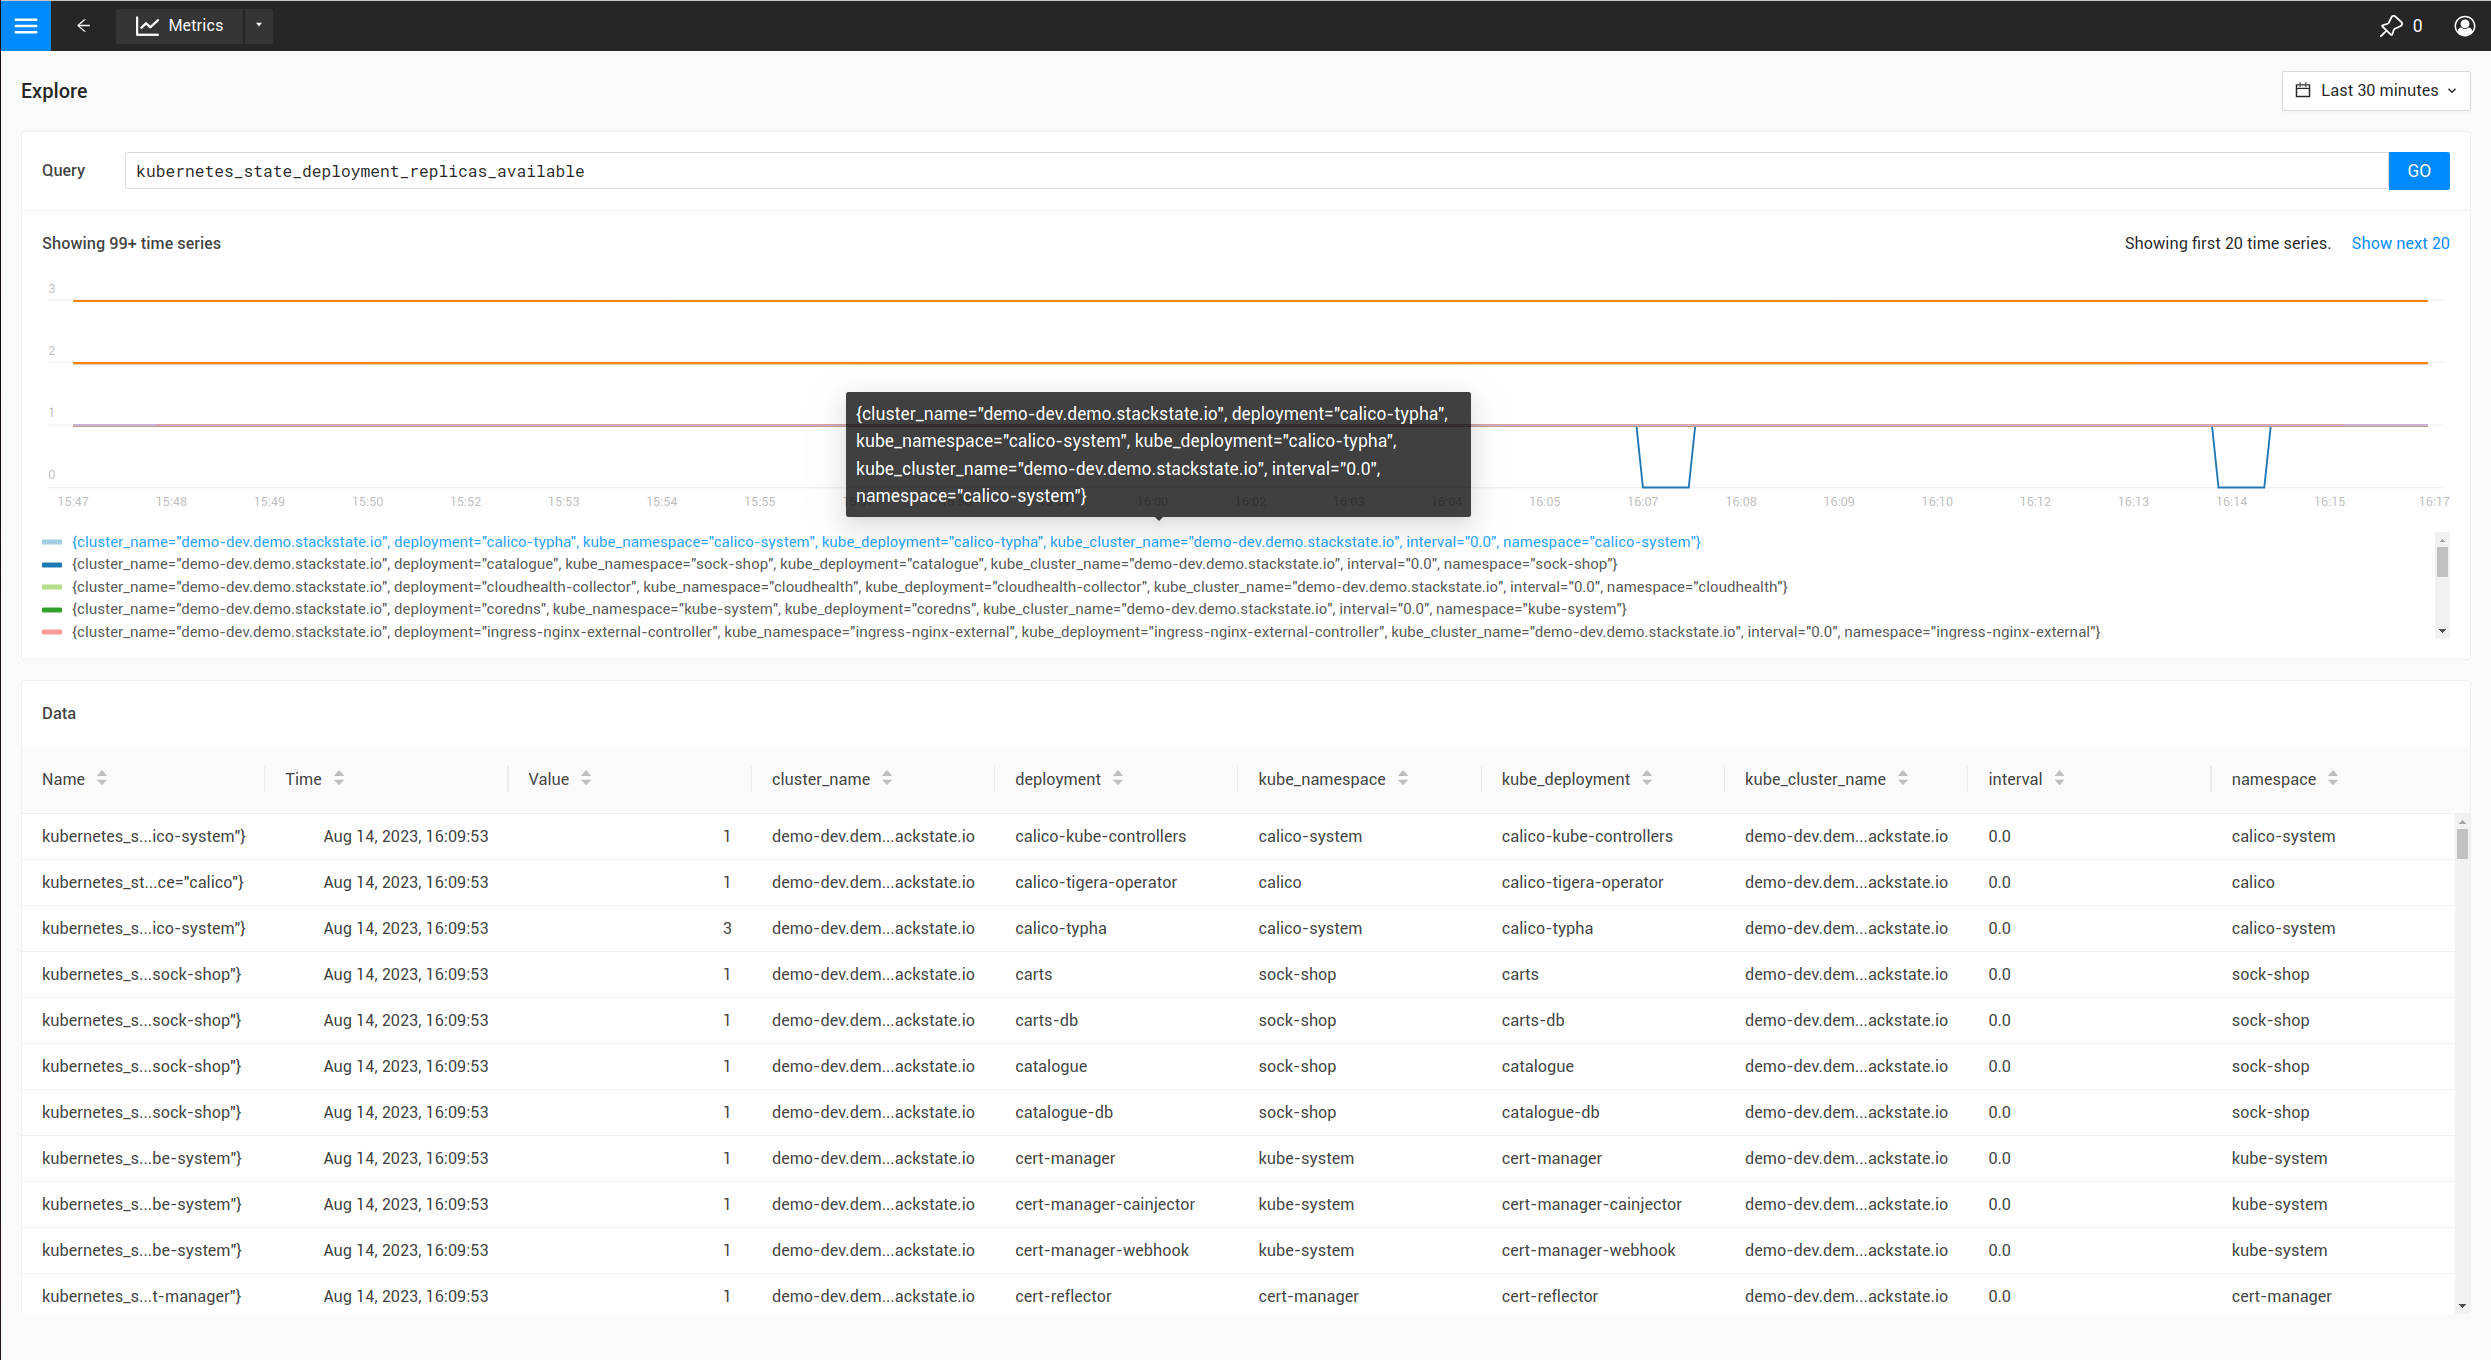
In the above table it’s shown the metric has labels like cluster_name, namespace and deployment.
Because the metric is observed on deployments, it’s most logical to bind the monitor results to deployment components. To do this, it’s required to understand how the identifiers for deployments are constructed:
-
In the UI, navigate to the
deploymentsview and select a single deployment. -
Open the
Topologyview, and click the deployment component. -
When expanding the
Propertiesin the right panel of the screen, the identifiers will show after hovering as shown below:
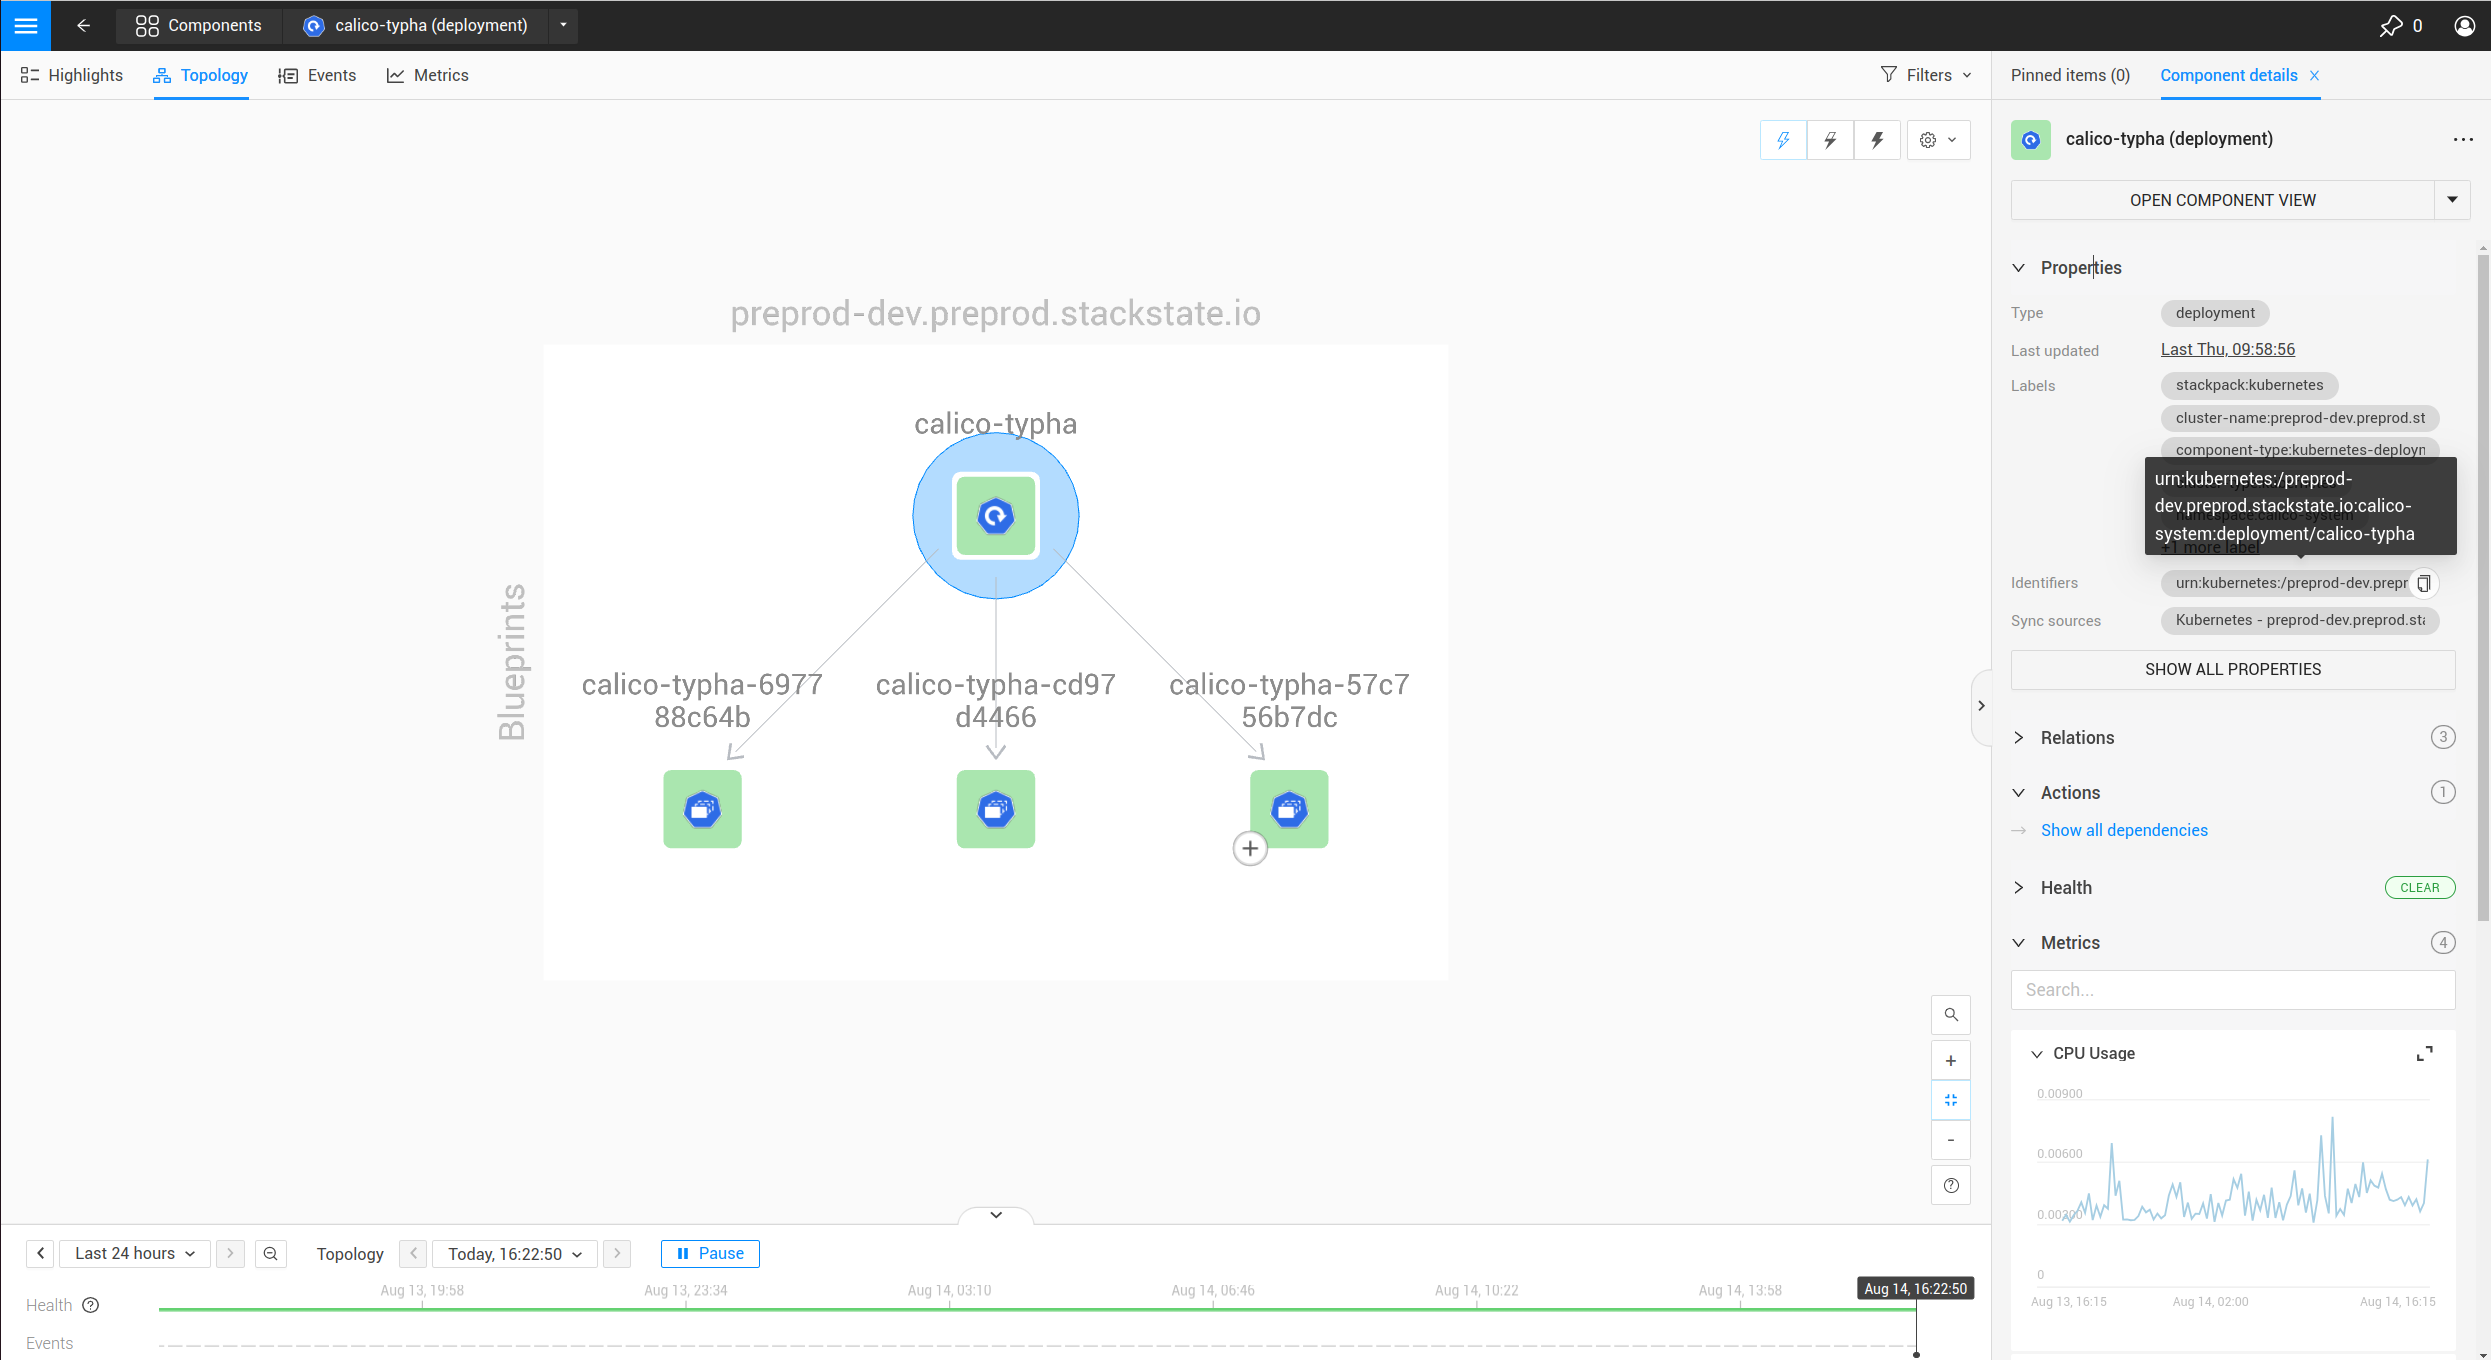
The identifier is shown as urn:kubernetes:/preprod-dev.preprod.stackstate.io:calico-system:deployment/calico-typha. This shows that the identifier is constructed based on the cluster name, namespace and deployment name. Knowing this, it’s now possible to construct the urnTemplate:
  ...
  urnTemplate: "urn:kubernetes:/${cluster_name}:${namespace}:deployment/${deployment}"
  ...
To verify whether the urnTemplate is correct, is explained further below.
Write the remediation hint
The remediation hint is there to help users find the cause of an issue when a monitor fires. The remediation hint is written in markdown. It’s also possible to use the labels that are on the time series of the monitor result using a handlebars template, as in the following example:
  ...
  remediationHint: |-
    To remedy this issue with the deployment {{ labels.deployment }}, consider taking the following steps:

    1. Look at the logs of the pods created by the deployment
  ...
To offer a remediation experience that conforms to that offered by the standard SUSE® Observability monitors, follow the Remediation guide guidelines.
Testing the monitor
After you have made a monitor, validate whether it produces the expected results. The following steps can be taken:
Create or update the monitor in SUSE® Observability
-
Use the Test Your StackPack command to deploy the StackPack.
sts stackpack test -d ./my-stackpack --yes
Verifying the results of a monitor
Verify the execution of the monitor
Go to the monitor overview page (http://your-instance/#/monitors) and find your monitor.
-
Verify the
Statuscolumn is inEnabledstate. If the monitor is inDisabledstate, enable it. If the status is inErrorstate, you can troubleshoot the error using the CLI. -
Verify you see the expected number of states in the
Clear/Deviating/Criticalcolumn. If this number is significantly lower or higher than the number of components you meant to monitor, the PromQL query might be giving too many results.
Verify the binding of the monitor
Observe whether the monitor is producing a result on one of the components that it’s meant to monitor for. If the monitor doesn’t show up, follow these steps to remedy.